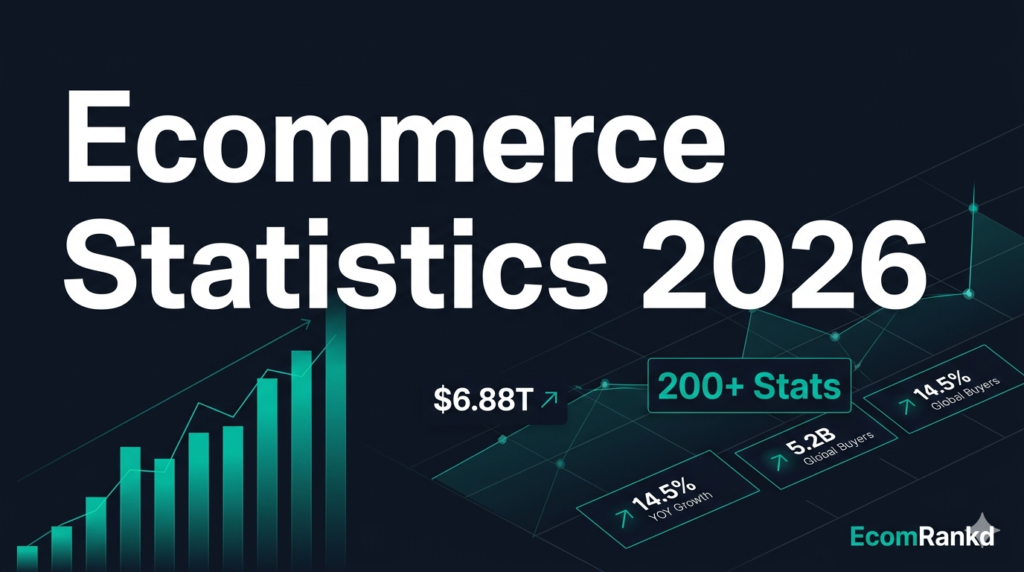
Ecommerce Statistics (2026)
The most complete data reference for ecommerce founders. Every number that matters, with context on what to actually do about it.
Every existing ecommerce statistics blog is a flat list with no context. A founder reading “cart abandonment is 70%” gains nothing without knowing what to do next. Every statistic in this guide includes a So what? — a direct founder implication that tells you what the number means for your business. Sections are organized by decision, not by topic, so you can jump to exactly what you are trying to figure out right now.
Ecommerce Market Size & Growth Statistics (2026)
The market is large, still growing, and far from saturated. Understanding where the growth is concentrated tells you which bets are worth making.
Growth by Region
| Region | 2026 Market Size | YoY Growth | Penetration Rate | Opportunity Signal |
|---|---|---|---|---|
| China | ~$3.4T | ~8% | 51.5% | Dominant — highest penetration globally |
| United States | $1.62T | 10.4% | 18% | Large, growing, still below global avg penetration |
| Europe | $805B | ~7% | ~20% | Mature but steady — fragmented by country |
| Latin America | $191B | 12.2% | ~10% | Fastest-growing accessible market for DTC brands |
| India | ~$150B | 15%+ | ~5% | Massive untapped — 1.4B population, 5% penetration |
| Southeast Asia | ~$130B | 15%+ | ~8% | Philippines leading regional growth |
The 2040 Projection Every Founder Should Know
By 2040, the share of online purchases is expected to rise to 95% of all retail sales globally, with physical stores accounting for just 5%. Ecommerce is not a channel — it is the future default of commerce. Every infrastructure decision you make today is a long-term bet on this trajectory.
Mobile Commerce Statistics (2026)
Mobile generates the majority of ecommerce traffic but converts at half the rate of desktop. That gap is your biggest single conversion opportunity in 2026.
Mobile Performance by Device & Platform
| Context | Conversion Rate | Benchmark |
|---|---|---|
| Desktop | 3.5% | The gold standard to aim for on mobile |
| Mobile web (average) | 2.1% | Global average — most stores fall below this |
| iOS app | 3.2% | Near-desktop performance when app UX is optimised |
| Android app | 2.4% | Above mobile web average |
| Touch-optimised mobile site | 2.3% | Above average — UX investment pays off |
| Mobile checkout (unoptimised) | 1.2% | Where most stores actually sit |
| Mobile with AR preview | 2.4% | AR delivers measurable mobile CVR lift |
The Mobile Conversion Gap: What It Costs You
If your store does $50,000/mo in revenue and 60% of your traffic is mobile converting at 1.5% while desktop converts at 3.5%, improving mobile CVR to just 2.5% would add approximately $10,000–$15,000/mo without a single additional visitor. Mobile optimisation is the most underinvested revenue lever in ecommerce.
Online Shopping Behaviour Statistics (2026)
Understanding why shoppers buy — and why they don’t — is the only reliable path to improving conversion without increasing ad spend.
What Actually Drives Purchase Decisions
| Factor | % of Shoppers Influenced | Founder Action |
|---|---|---|
| Free / low-cost shipping | 79–90% | Add free shipping threshold above current AOV |
| Product reviews (11–30 reviews) | 68% higher CVR vs zero | Install Judge.me, automate review requests |
| Personalised recommendations | 91% more likely to buy | Add recommendation engine to product pages |
| Fast page load | 100ms delay = 7% CVR drop | Run PageSpeed Insights, target LCP < 2.5s |
| Guest checkout available | Reduces abandonment 35%+ | Enable guest checkout in Shopify settings |
| Social proof (UGC, photos) | 102% higher CVR with UGC | Incentivise photo reviews with post-purchase discounts |
| Return policy visible | 67% check before buying | Add returns policy link above fold on PDP |
Ecommerce Conversion Rate Statistics & Benchmarks (2026)
The global average ecommerce conversion rate is 1.65%. But that number hides a 6× spread between industries. Where you sit relative to your category benchmark is what matters.
Conversion Rate by Industry Benchmark
| Industry | Average CVR | Top Performer CVR | Key Conversion Driver |
|---|---|---|---|
| Food & Grocery | 3.5–5% | 6%+ | Subscription & replenishment |
| Beauty & Personal Care | 3–4% | 5% | Reviews, UGC, before/after content |
| Pet Supplies | 3% | 4.5% | Subscription, bundles |
| Health & Supplements | 2.5% | 4% | Reviews, trust signals, subscription |
| Apparel & Fashion | 1.5–2.5% | 3.5% | Size guides, UGC, easy returns |
| Electronics | 1–2% | 3% | Comparison content, specs, reviews |
| Home & Furniture | 0.8–1.5% | 2.5% | AR previews, detailed imagery |
| Luxury Goods | 0.5–1% | 1.5% | Brand storytelling, scarcity, exclusivity |
Cart Abandonment Statistics (2026)
70 cents of every dollar shoppers intend to spend gets left behind. Cart abandonment is the biggest single revenue leak in ecommerce — and the most recoverable.
Top Reasons for Cart Abandonment
| Reason | % of Shoppers | Fix |
|---|---|---|
| Unexpected shipping costs | 48% | Show costs early, add free shipping threshold |
| Required account creation | 26% | Enable guest checkout |
| Complicated checkout process | 22% | Reduce checkout steps, enable Shop Pay / Apple Pay |
| Payment security concerns | 19% | Add trust badges, SSL, recognised payment logos |
| Slow delivery times | 18% | Be transparent about delivery estimates |
| Unsatisfactory return policy | 16% | Add visible returns policy above fold |
| Not enough payment methods | 13% | Add Apple Pay, Google Pay, BNPL |
Revenue Leak Calculator
If your store generates $30,000/mo in completed sales with a 70% abandonment rate, your cart value before abandonment is approximately $100,000/mo. Recovering just 10% of abandoned carts at your current AOV adds $10,000/mo — $120,000/year — before you spend a dollar on acquisition.
Ecommerce Email Marketing Statistics (2026)
Email remains the highest-ROI marketing channel in ecommerce, and automation makes it exponentially more powerful than broadcast campaigns.
Email Automation Benchmarks by Type
| Email Type | Open Rate | Click Rate | Conversion Rate | Priority |
|---|---|---|---|---|
| Welcome series | 83.63% | ~20% | ~3–5% | Launch first |
| Abandoned cart (email 1) | ~50% | ~15% | ~3–4% | Launch first |
| Back-in-stock | 59.19% | ~12% | 5.34–7.28% | High priority |
| Post-purchase sequence | ~45% | ~12% | ~2–4% | High priority |
| Browse abandonment | ~38% | ~10% | ~1.5–3% | Medium priority |
| Win-back / re-engagement | ~28% | ~8% | ~1–2% | Medium priority |
| Promotional broadcast | ~25% | ~5% | ~0.5–1% | Low priority (build flows first) |
SMS & Push Notification Statistics for Ecommerce (2026)
SMS and web push are the two fastest-growing owned channels in ecommerce. Combined with email, they form a complete recovery and retention stack.
Owned Channel Comparison
| Channel | Open / Read Rate | Conversion Rate | Opt-in Friction | Cost | Best Use |
|---|---|---|---|---|---|
| 30.7% | 1–5% | Low | Low | Flows, nurture, broadcasts | |
| SMS | 98% | 3–8% | Medium | Medium–High | Abandoned cart, flash sales |
| Web push | ~20% | 2–5% | Very low | Very low | Back-in-stock, price drops, cart |
| ~80% | 4–10% | Medium | Medium | Order updates, support, upsells |
Customer Retention & Loyalty Statistics (2026)
Retention is the most underfunded growth lever in ecommerce. The math is unambiguous: existing customers cost less to sell to and buy more often.
Retention Rate by Category
| Category | Average Retention Rate | Benchmark Interpretation |
|---|---|---|
| Grocery & Food | 65.2% | Highest — weekly need drives repeat purchase naturally |
| Pet Supplies | 55–60% | High repurchase — subscription model ideal |
| Beauty & Skincare | 45–55% | High with subscription; moderate without |
| Health & Supplements | 40–50% | Monthly replenishment creates natural loyalty window |
| Apparel & Fashion | 25–35% | Seasonal — loyalty program significantly improves this |
| Home & Furniture | 15–25% | Low frequency — focus on referrals over repeat purchase |
| Electronics | 15–20% | Long replacement cycle — accessories & upsells matter most |
| Luxury Goods | 9.9% | Lowest — brand storytelling and exclusivity are the retention levers |
AI in Ecommerce Statistics (2026)
AI has crossed from experimental to essential. Stores implementing AI personalisation are reporting 15–25% revenue increases — with the gap widening between adopters and laggards.
AI Adoption Maturity in Ecommerce
| Maturity Level | What It Looks Like | % of Stores | Revenue Impact |
|---|---|---|---|
| Level 1 — None | No AI tools, manual marketing | ~20% | Baseline |
| Level 2 — Basic | Email automation, basic recommendations | ~40% | +5–10% |
| Level 3 — Intermediate | Behavioural segmentation, chatbots, predictive restock | ~30% | +10–20% |
| Level 4 — Advanced | Full AI personalisation, dynamic pricing, predictive LTV | ~8% | +15–25% |
| Level 5 — Agentic | AI agents acting autonomously (reorder, pricing, support) | <2% | Emerging |
Ecommerce Platform & Marketplace Statistics (2026)
Where you build matters almost as much as what you build. Platform and marketplace decisions determine your margin structure, data ownership, and growth ceiling.
Platform Market Share Comparison
| Platform | Global Market Share | US Market Share | Best For |
|---|---|---|---|
| Shopify | 10.56% | 30% | DTC brands, all sizes, ecosystem depth |
| WooCommerce | 18% | ~22% | WordPress-native, content-heavy stores |
| Wix | 15% | ~12% | Small/micro businesses, ease of use |
| BigCommerce | ~3% | ~5% | Mid-market, B2B, headless |
| Magento/Adobe | ~2% | ~4% | Enterprise, custom requirements |
Ecommerce Shipping & Returns Statistics (2026)
Shipping expectations have been permanently reset by Amazon. Returns are a profit drain that grows with revenue unless actively managed.
Ecommerce Payments & Checkout Statistics (2026)
Payment friction at checkout is responsible for a significant portion of cart abandonment. Every additional payment option and checkout step you remove converts a measurable number of additional customers.
Checkout Optimisation Checklist for Founders
| # | Checkout Element | Revenue Impact | Difficulty |
|---|---|---|---|
| 1 | Enable guest checkout | High | One setting change |
| 2 | Add Apple Pay / Google Pay / Shop Pay | High | Low effort |
| 3 | Show shipping costs early (cart page) | High | Low effort |
| 4 | Add free shipping threshold bar | High (also lifts AOV) | Low effort |
| 5 | Add BNPL option (Klarna, Afterpay) | Medium–High | Low effort |
| 6 | Add trust badges at checkout | Medium | Low effort |
| 7 | Enable address autofill | Medium | Low effort |
| 8 | Reduce checkout to single page | Medium–High | Medium effort |
| 9 | Add progress indicator in checkout | Low–Medium | Low effort |
| 10 | Optimise page speed (LCP < 2.5s) | High | Medium effort |
B2B Ecommerce Statistics (2026)
B2B ecommerce is 5× larger than B2C — and B2B buyers now expect the same digital experience as consumer shoppers.
Ecommerce Sustainability Statistics (2026)
Sustainability is moving from a PR exercise to a purchase factor. The data is clear: shoppers who care about it will choose competitors who demonstrate it.
Emerging Technology Statistics in Ecommerce (2026)
AR, voice, and subscriptions are no longer emerging — they are scaling. The categories that adopt them earliest will build durable conversion advantages.
The EcomRankd Founder Benchmark Dashboard
No other statistics blog tells you where you stand. Use this benchmark table to self-assess your store against what’s typical at your revenue tier — and identify your highest-priority gap.
| Metric | Under $10k/mo | $10k–$100k/mo | $100k+/mo | Your Gap? |
|---|---|---|---|---|
| Conversion rate | 1–1.5% | 1.5–2.5% | 2.5–4%+ | If below range: fix checkout & mobile |
| Mobile CVR | 0.8–1.2% | 1.2–2% | 2–3% | If below range: mobile UX is priority #1 |
| Cart abandonment | 72–80% | 68–74% | 65–70% | Above range: checkout friction or shipping |
| Email revenue share | 5–10% | 15–25% | 25–40% | Below range: launch automation flows first |
| Repeat purchase rate | 10–20% | 20–35% | 35–50% | Below range: add loyalty + retention flows |
| Average order value | $45–$75 | $65–$120 | $100–$200+ | Below range: add upsells + bundle offers |
| LTV:CAC ratio | 1:1–2:1 | 2:1–3:1 | 3:1–5:1+ | Below 3:1: focus on retention, not acquisition |
| Review count (per product) | 0–10 | 10–50 | 50–200+ | Below range: automate review requests |
| Email automation % of orders | 5–10% | 10–20% | 20–35% | Below range: flows before blasts |
| Social commerce revenue % | 0–5% | 5–15% | 10–25% | Zero: activate TikTok/Instagram shopping |
How to Use This Table
Find the two metrics where your store sits furthest below the benchmark for your revenue tier. Those two gaps represent your highest-priority growth levers — not the areas where you are already performing. Fix the biggest gap first, measure for 60 days, then move to the next. This is more valuable than any single statistic in this article.
Social Commerce Statistics (2026)
Social commerce is growing at 30%+ annually and has already crossed $2 trillion globally. The platforms your shoppers live on are now also where they buy.
Social Commerce Platform Breakdown
Asia-Pacific Holds 90% of Global Social Commerce Value
China’s social commerce conversion rate of 30% — versus the global average of 1.65% for standard ecommerce — is not a fluke. It reflects a decade of live-streaming commerce infrastructure that is now migrating West via TikTok. What you are seeing emerge in the US today is the early stage of a structural shift that China already completed.